
Free Stock Portfolio Tracker Template Excel & PDF Download Tracker
What is a Stock Portfolio Tracker?
A Stock Portfolio Tracker is a simple tool that helps you record and monitor all your stock investments in one place. It shows your total investment value, profit or loss, and overall performance, making it easier to track your stock investing journey and make better decisions.
Why Stock Portfolio Tracking is Essential?
Keeping track of your stock investments is one of the most important habits for successful investors. It helps you understand how your money is performing, identify winning and losing stocks, and stay disciplined with your long-term investing goals.
Benefits of Stock Portfolio Tracking
- Get a clear view of your total investment value and returns
- Quickly see profit or loss on individual stocks
- Understand your portfolio diversification
- Make informed decisions about buying or selling stocks
- Stay motivated by tracking your progress toward financial goals
What Happens If You Don’t Track Your Portfolio?
lose sight of their actual performance, hold losing stocks too long, miss opportunities to rebalance, and make emotional decisions that hurt their returns.
How to Use the Stock Portfolio Tracker Template
Our template is designed to be simple, practical, and perfect for beginners. Follow these steps:
Step-by-Step Guide
- Download the Template Choose Excel (for automatic calculations and charts) or PDF (for printing).
- Add Your Stocks Enter details for each stock you own.
- Update Current Prices Refresh the current market price regularly.
- Review Performance Check total portfolio value, profit/loss, and allocation.
- Track Over Time Update monthly to see how your portfolio is growing.
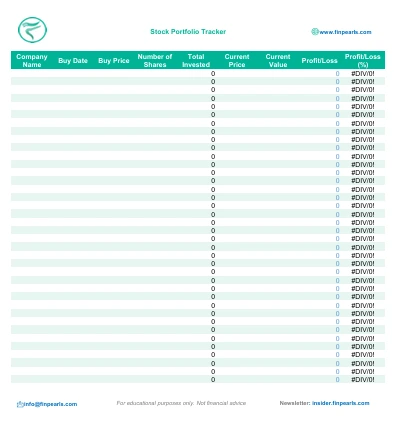
What Each Column Means (With Examples)
Main Tracking Table
| Column | What It Means | Example |
|---|---|---|
Company Name |
Name of the stock or company |
Apple Inc. |
Buy Date |
Date you purchased the shares |
15-Mar-2025 |
Buy Price |
Price per share at purchase |
150 |
Number of Shares |
How many shares you own |
50 |
Total Invested |
Total money invested in this stock |
7500 |
Current Price |
Latest market price |
180 |
Current Value |
Current total value of these shares |
9000 |
Profit/Loss ($) |
Profit or loss on this stock |
1500 |
Profit/Loss (%) |
Percentage gain or loss |
20% |
How to Use This Template
- Add one row for each stock you own.
- Update Current Price weekly or monthly.
- Review the Summary section to see total portfolio value and overall performance.
Example Entry Company Name: Apple Inc. | Buy Date: 15-Mar-2025 | Buy Price: 150 | Number of Shares: 50 | Total Invested: 7500 | Current Price: 180 | Current Value: 9000 | Profit/Loss ($): 1500 | Profit/Loss (%): 20%
Pro Tips for Best Results
- Update current prices regularly for accurate tracking.
- Use conditional formatting (Green = Profit, Red = Loss).
- Review your portfolio every month and rebalance if needed.
- Combine this tracker with your Monthly Budget Planner to link saving and investing.
Ready to Track Your Stock Investments? Download the Free Stock Portfolio Tracker Template now and take control of your investing journey.